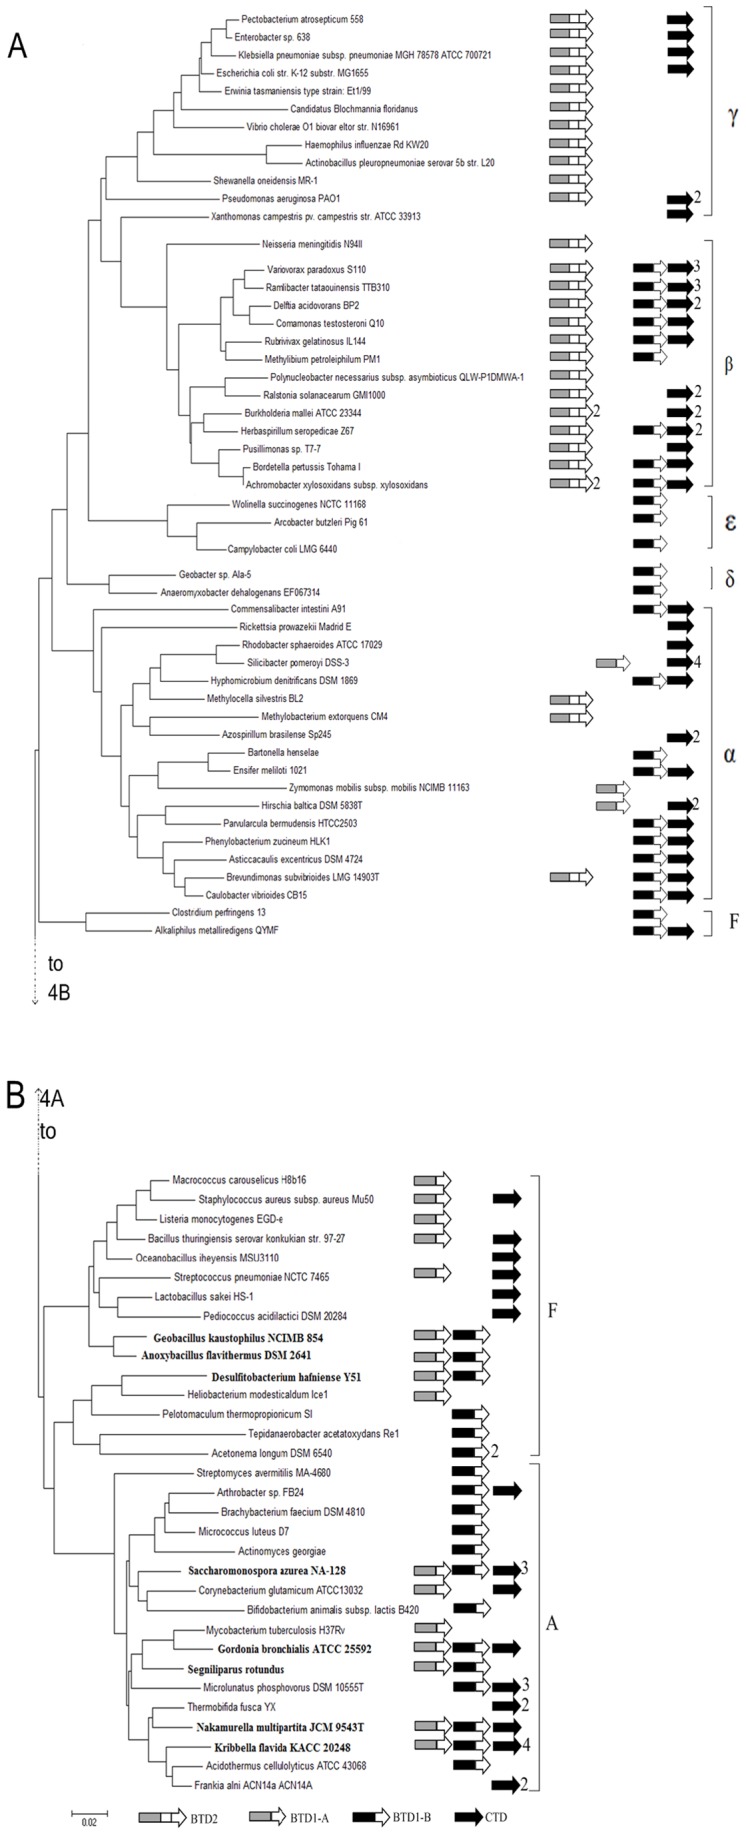
Figure 4. Phylogenetic tree based on 16S rDNA sequences showing the phylogenetic distribution of the TD enzyme.

The phylogenetic tree was constructed with MEGA 5 software using sequences from RDP database. Because it is too big to show in a single page, the structure of the phylogenetic tree is divided into two panels (A and B). The connecting point of the tree segments in the two panels is marked with a broken line. The scale bar indicates 0.02 change per nucleotide. The arrows at the right represent the TDs that could exist in the bacterium and the numbers next to the arrow show the number of genes that might encode the TD.
