Figure 2.

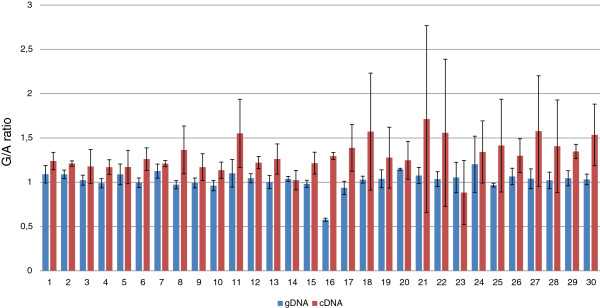
The ratio of G/A alleles. Two bars represents one individual (heterozygous carrier of the c.551+ 19G>A), the red one represent ratio of G/A in cDNA, the blue one in gDNA and data is expressed as mean±SE.

The ratio of G/A alleles. Two bars represents one individual (heterozygous carrier of the c.551+ 19G>A), the red one represent ratio of G/A in cDNA, the blue one in gDNA and data is expressed as mean±SE.