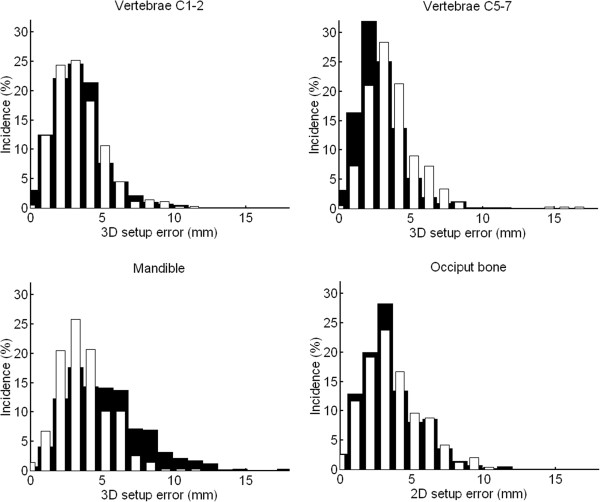
Figure 2.

3D setup errors for the four subregions. The black bars present the results of the MID_PTV match, while the white bars demonstrate the results of the MIN_MAX match. The errors present daily imaging and include observer variation. Note that 2D errors are given for the occiput bone.
