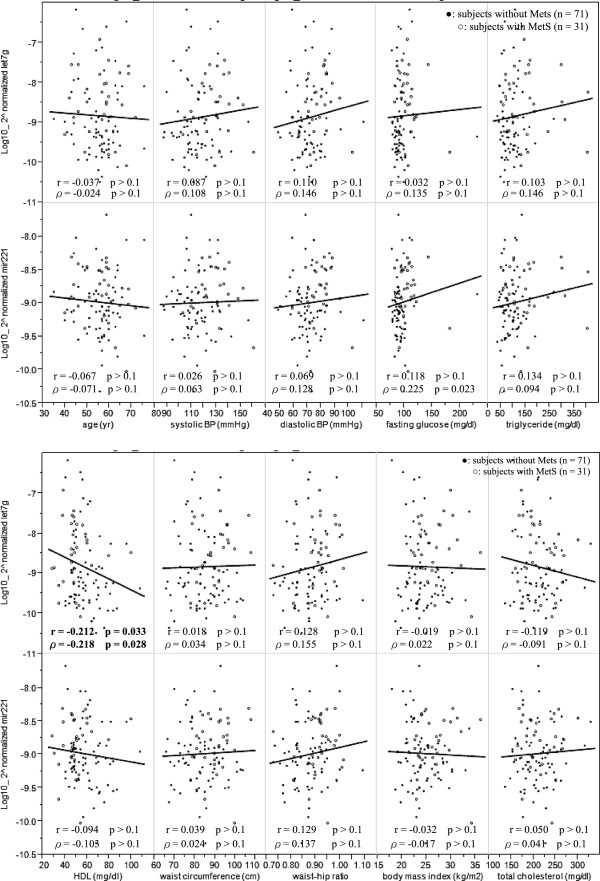
Figure 2.
The associations between the individual miRNAs and the MetS risk components. Correlations between the expression level of the circulating miRNAs and the individual component of metabolic syndrome. The relationships were assessed by Pearson’s and Spearman’s correlation (r, Pearson’s correlation coefficient; ρ,Spearman’s coefficient). HDL, high-density lipoprotein cholesterol; BP, blood pressure.

