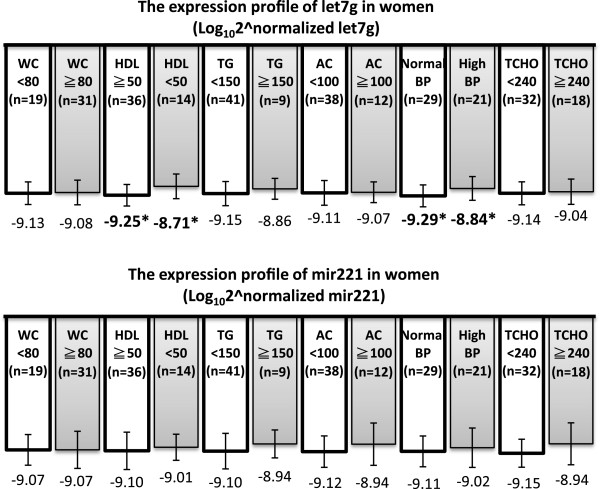
Figure 4.
Comparisons of the expression profiles of circulating miRNAs in women according to each abnormal components of MetS. Female subjects were separated to two groups using the criteria of individual MetS components. * Significant difference (p < 0.05) between the groups adjusted by age. All of the data were analyzed through non-parametric Mann–Whitney U tests. WC, waist circumstance; HDL, high-density lipoprotein cholesterol; TG, triglycerides; AC, fasting blood sugar; BP, blood pressure; TCHO, total cholesterol.

