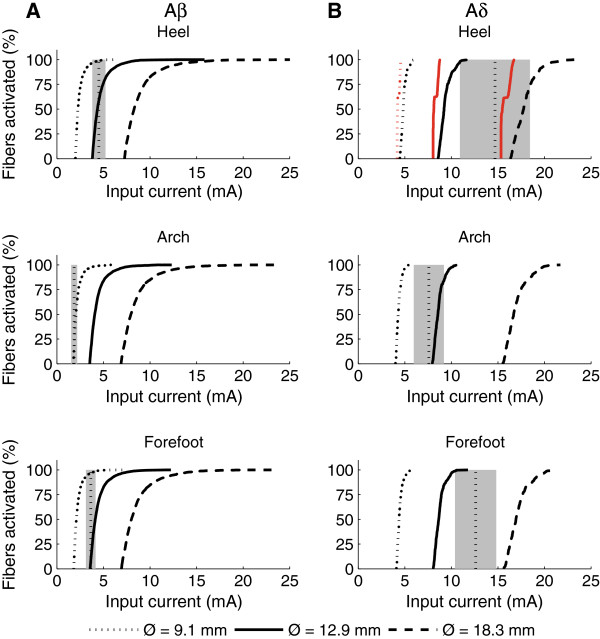
Figure 6.
Calculated stimulus–response curves for modeled Aβ and Aδ nerve fibers. Generally Aδ fibers (B) had higher thresholds than Aβ fibers (A). Three electrode sizes were modeled and the larger electrodes required larger stimulation currents to activate the nerve fibers. For the Aδ fibers at the heel, the red curves are the stimulus–response functions from models without intraepidermal nerve fibers (IENFs). The lack of IENFs decreased the activation threshold. The grey areas depict experimental values of perception and pain threshold (mean ± 95% confidence intervals). Perception thresholds are depicted with the Aβ fibers and the pain thresholds are depicted with Aδ fibers. Original data taken from [30], using an electrode diameter of 8 mm. Simulated pulse durations were set to 1 ms.

