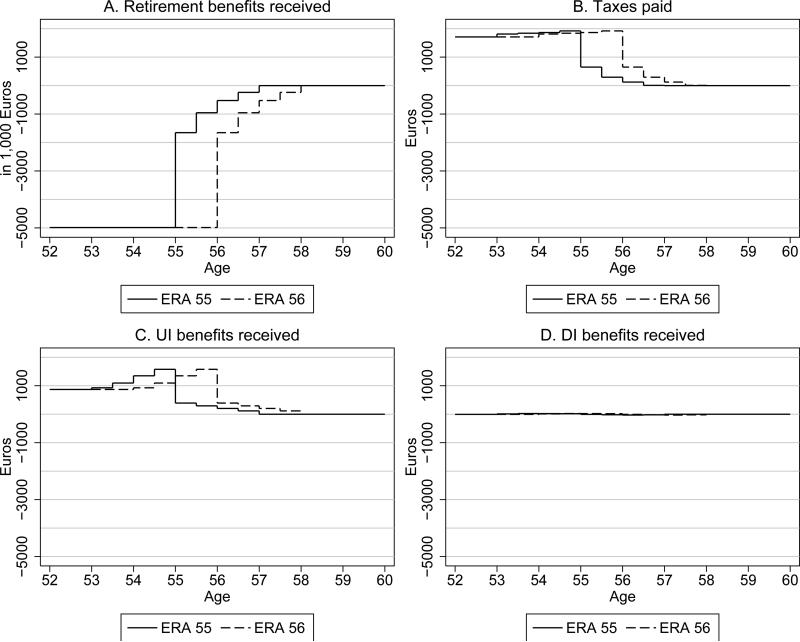
Figure 7.
Impact of ERA increase by 1 year on retirement benefits, taxes, UI benefits, and DI benefits by age for women
Notes: This figure displays the impact of the ERA on retirement benefits, taxes, UI benefits, and DI benefits in a given half-year age interval relative to the baseline category (age≥ERA+2). The size of the effect for a particular age interval is obtained by adding up the estimated coefficients from Table 7. For example, if the ERA is 55 the effect of the ERA on retirement benefits in the age interval 55.5-56 (relative to the age group 57-59) is obtained by summing up the estimated coefficients on I(age<ERA+1), I(age<ERA+1.5), and I(age<ERA+2) in column (5) of Table 7. Source: Own calculations, based on Austrian Social Security Data.

