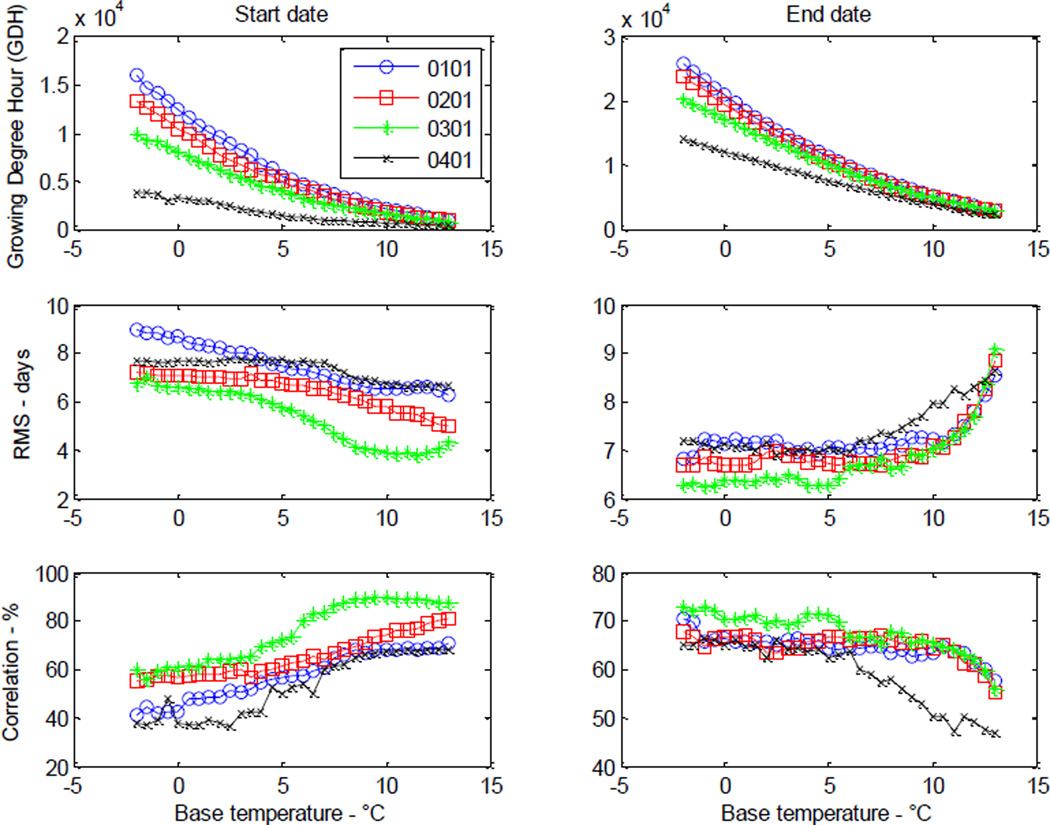
Figure 4.
Optimum GDHs (Top Panel) of start and end dates with different initial dates and base temperatures for birch pollen at the Cherry Hill, New Jersey station. Also plotted are the corresponding Root Mean Square (RMS) errors (Middle Panel) and correlation coefficients (Bottom Panel) with respect to observed pollen data.

