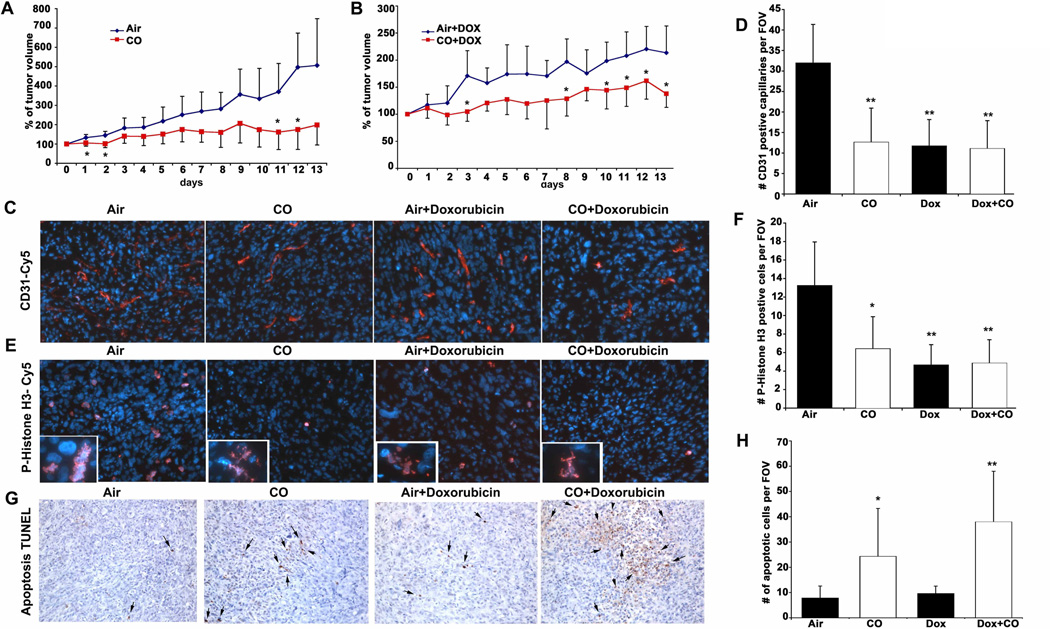
Figure 3. CO blocks tumor growth of established PC3 xenografts and sensitizes tumor cells to doxorubicin treatment.
A–B. Growth curves (% of original tumor volume) of PC3 cells inoculated into nude mice for 2 weeks prior to initiation of treatment with air or CO (250 ppm, 1h day) ± Doxorubicin, which was continued for an additional two weeks before harvest. Results are mean ± SD of n=4–5 per group. C–F. Immunostaining of CD31 (C) and P-Histone H3 (E) in PC3 tumors. Quantitation of CD31 (D) or PH3-positive (F) cells was counted as the percentage of positive cells/field of view (20x magnification). Results represent mean±SD of 8–10 sections from each harvested tumor. E–F. TUNEL staining quantitated as % of positive cells per field of view (20x magnification). Results represent mean±SD of 8–10 sections from each harvested tumor. **p<0.01vs Air; *p<0.05 vs Air.

