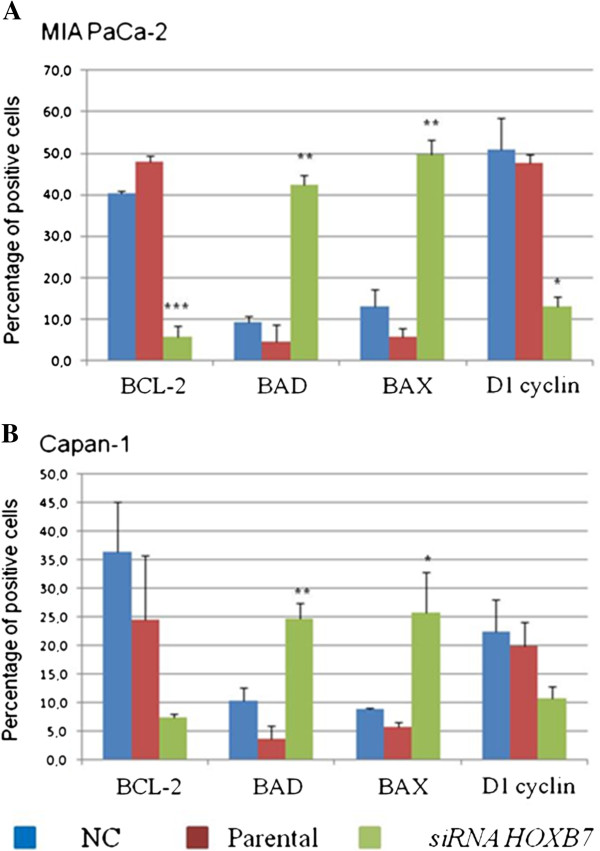
Figure 6.
BCL-2, BAD, BAX and D1 cyclin expression as evaluated by flow cytometry. Panels A and B demonstrate MIA PaCa-2 and Capan-1 cells lines, respectively. The experiments were carried out in triplicate and the bars represent mean ± standard deviation. NC- negative control. * p <0.05, ** p <0.01, *** p <0.001.

