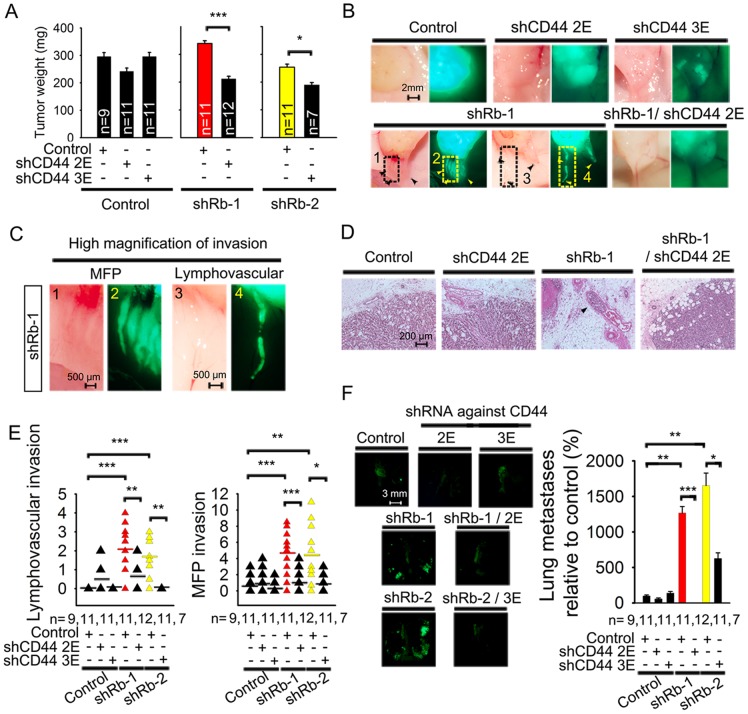
Figure 5. CD44 expression is essential for lymphovascular invasion and lung metastases initiated by Rb knockdown.
(A) Weight of orthotopic primary tumors initiated by MCF7ras cells with double knockdown of Rb and CD44 eight weeks after mammary fat pad injection. Rb shRNAs and one of the control shRNAs were expressed in a vector conferring puromycin resistance. CD44 shRNAs and the second control shRNA were expressed in an EGFP vector. Data are presented as mean ± SD, n is the number of mice in each group. Equal variance Student's t-test, * p<0.05, *** p<0.001. (B) Representative phase contrast and fluorescent images of tumor-attached EGFP-positive cancer cells/clusters invading mammary fat pad or adjacent capillaries. Analysis was performed on the whole animal post mortem. Scale bar, 2 mm. (C) Representative high magnification phase contrast and fluorescent images of Rb-1 shRNA from Figure 5B with visible MFP and lymphovascular invasion. Scale bar, 500 μm. (D) H&E staining of primary tumors from mice injected with Rb and CD44 double knockdown cells. Arrows indicate areas of lymphovascular invasion. Scale bar, 200 μm. (E) Quantification of collective cell invasion into host mammary fat pad and extratumoral capillaries. Mammary fat pad invasion was quantified as incidence of EGFP-positive cell clusters in the area adjacent to tumor and not within a capillary (as judged by presence of erythrocytes in the phase contrast image). Cell clusters considered to be within a capillary were counted as lymphovascular invasion. Number of animals in each group is indicated as n. Unequal variance Student's t-test, * p<0.05, ** p<0.01, *** p<0.001. (F) Fluorescent images and quantification of lung metastases' numbers initiated by primary tumors 8 weeks after implantation of MCF7ras cells with double knockdown of Rb and CD44 into mammary fat pad. Number of metastases were quantified by ImageJ and normalized to the weight of primary tumor; number of animals in each group is indicated by n. Scale bar on fluorescent images, 3 mm. Unequal variance Student's t-test, * p<0.05, ** p<0.01, *** p<0.001.

