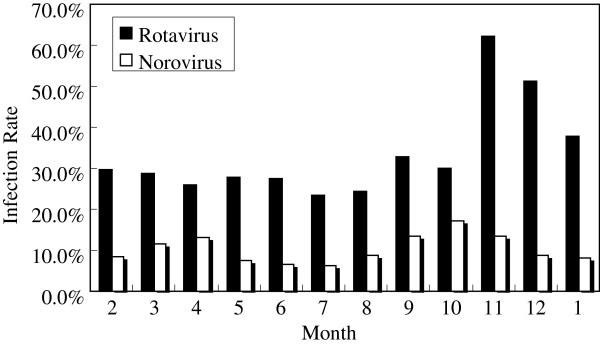
Figure 2.

Monthly distribution of rotavirus and norovirus infections between February 2011 and January 2012. Rates of rotavirus infection: 29.8%; 28.8%; 25.9%; 27.9%; 27.4%; 23.4%; 24.3%; 32.8%; 30.1%; 62.2%; 51.3%; 37.9%. Rates of norovirus infection: 8.5%; 11.5%; 13.0%; 7.4%; 6.5%; 6.3%; 8.6%; 13.4%; 17.2%; 13.5%; 8.9%; 8.2%.
