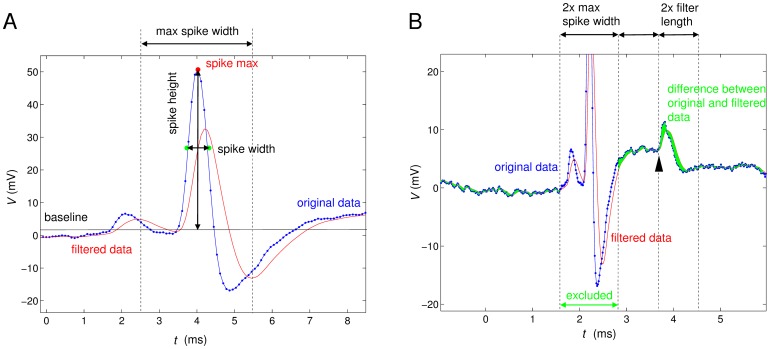
Figure 1. Illustration of the calculation of spike height, spike width and noise amplitude.
A) Spike height and width: The blue trace represents the original voltage data with small blue markers indicating the sampling. The red line is the moving average, which is used in spike detection. The black horizontal line represents the baseline value that is calculated by averaging the membrane potential in windows to the left and the right of the spike. The spike height is determined as the difference of the maximal voltage value of the spike and the baseline value. The spike width is measured as the distance of the two closest measurements below the half-height of the spike. B) Short time scale noise amplitude: The difference is taken between the original membrane potential measurement V
m and the filtered membrane potential measurement V
avg (moving average, see Figure 1A), and its Euclidean norm (normalised by 2 times the filter length +1) is calculated over two filter lengths,  (1) e.g. the noise level at the arrowhead is calculated from the marked interval of 2 filter lengths. The areas of 2 maximal spike widths (2×3 ms) around every detected spike are excluded from this calculation and the local noise level is undefined in these areas around spikes.

