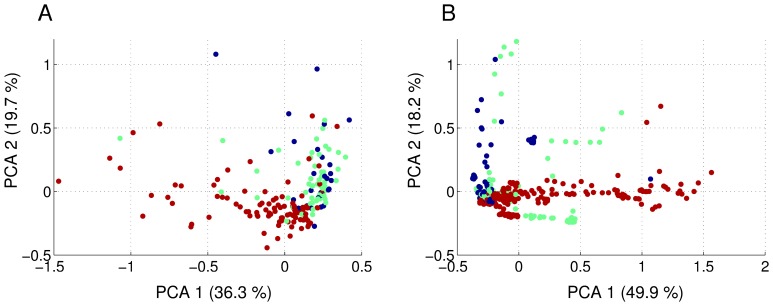
Figure 4. Principal component analysis in the 16 dimensional feature space.
The plots display the first two principal components of all considered recordings in data set 1 (A) and data set 2 (B). Each point represents one recording and is colour coded as a good (red), intermediate (green) or bad (blue) recording, according to evaluation by researcher 1. We note that there is a systematic structure to the clouds of points representing the three recording qualities but the clusters are not fully separated.

