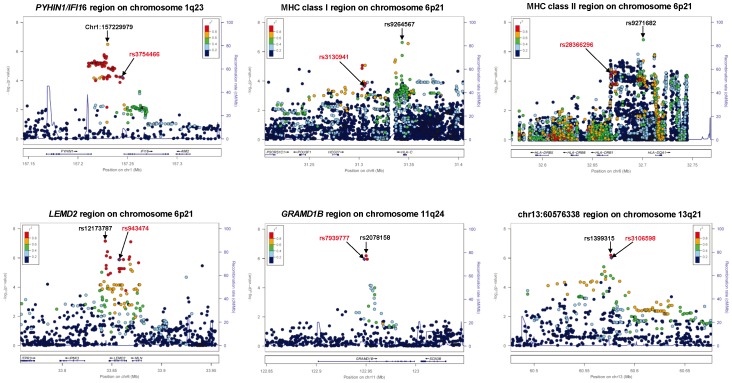
Figure 3. Fine-mapping identification of 6 candidate genomic regions.
Plots show the association results of both genotyped and imputed SNPs in the primary GWAS cohort. The most strongly associated SNPs (black letters) in the GWAS and the SNPs used for the replication studies (red letters) are indicated by arrows. The color of each circle reflects the LD (r2) between a particular SNP and the SNP used for the replication studies.

