
Figure 2.
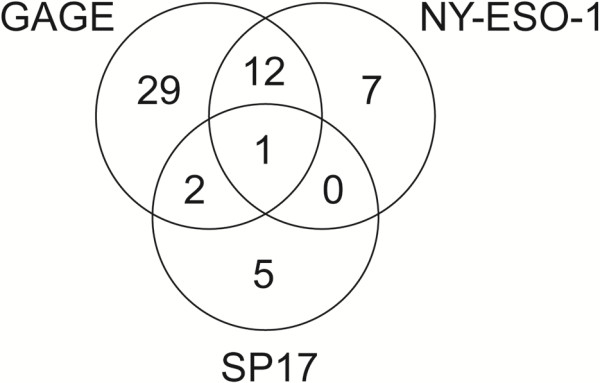
Venn diagram demonstrating overlap between GAGE, NY-ESO-1 and SP17 expression in NSCLC specimens. Numbers represent positive tumors among the total of 169 NSCLC specimens included in the analysis.
Official websites use .gov
A
.gov website belongs to an official
government organization in the United States.
Secure .gov websites use HTTPS
A lock (
) or https:// means you've safely
connected to the .gov website. Share sensitive
information only on official, secure websites.
Venn diagram demonstrating overlap between GAGE, NY-ESO-1 and SP17 expression in NSCLC specimens. Numbers represent positive tumors among the total of 169 NSCLC specimens included in the analysis.