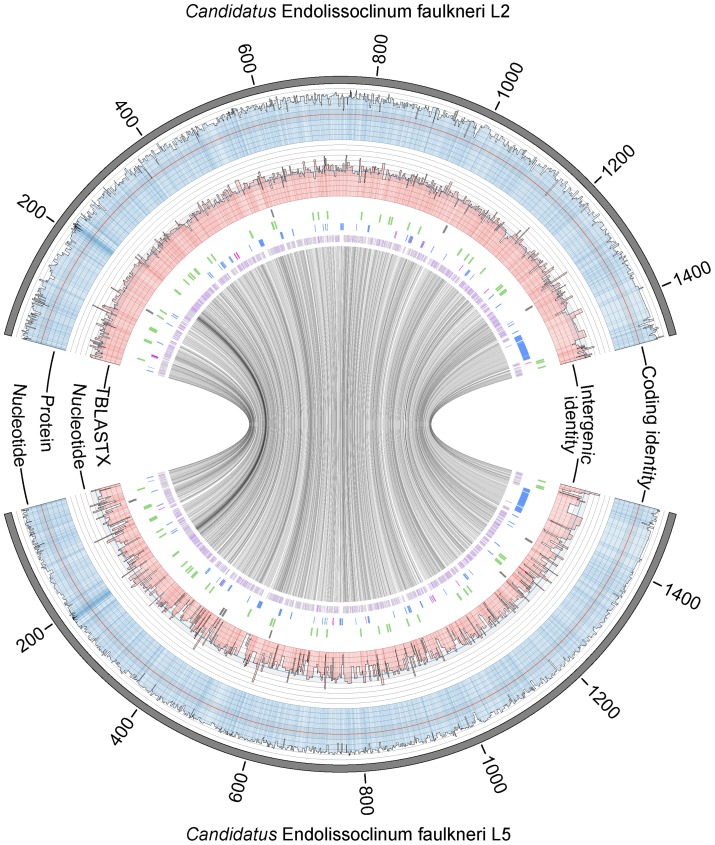
Figure 3. Comparative map of the genomes of Ca. E. faulkneri L2 (top) and L5 (bottom).
Outer line graphs show protein and nucleotide identities for corresponding coding and noncoding regions (as indicated). In each case the scale runs outwards from 0–100% with lines at intervals of 10%. The 50% line is shown in a contrasting color (red or blue, as appropriate). Note: These graphs are reciprocal and interchangeable, and are plotted against either L2 or L5 for clarity. Immediately inside line graphs are shown the positions of pseudogenes (grey), RNA genes (green), genes that do not have homologs in BAL199, but are shared by both Ca. E. faulkneri strains (blue, this category includes all ptz genes), and genes that do not have homologs in BAL199, and are unique to one Ca. E. faulkneri strain (magenta). The remaining genes (i.e. genes that have a homolog in BAL199), are shown in the innermost track. Note: positioning of the gene categories on different tracks are to allow effective visualization of some positions that overlap due to the pxiel width in the figure. The inner circle shows links between homologous protein coding genes in the two strains of Ca. E. faulkneri.

