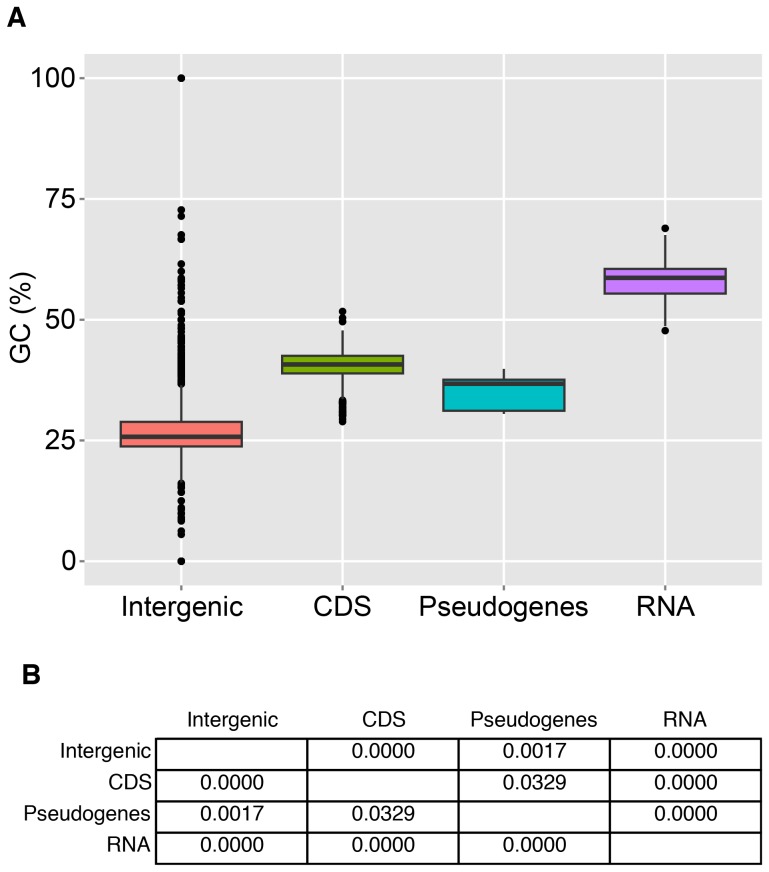
Figure 8. The Ca. E. faulkneri genome is made up of regions with different GC content.
The GC content of discrete regions (for example, all coding sequences) from the genomes of both Ca. E. faulkneri strains were tabulated and used to create the boxplot shown in (A). The groups were determined to be different from one another by ANOVA followed by Tukey HSD (see Materials and Methods). The individual p values for the pairwise comparisons are shown in (B).

