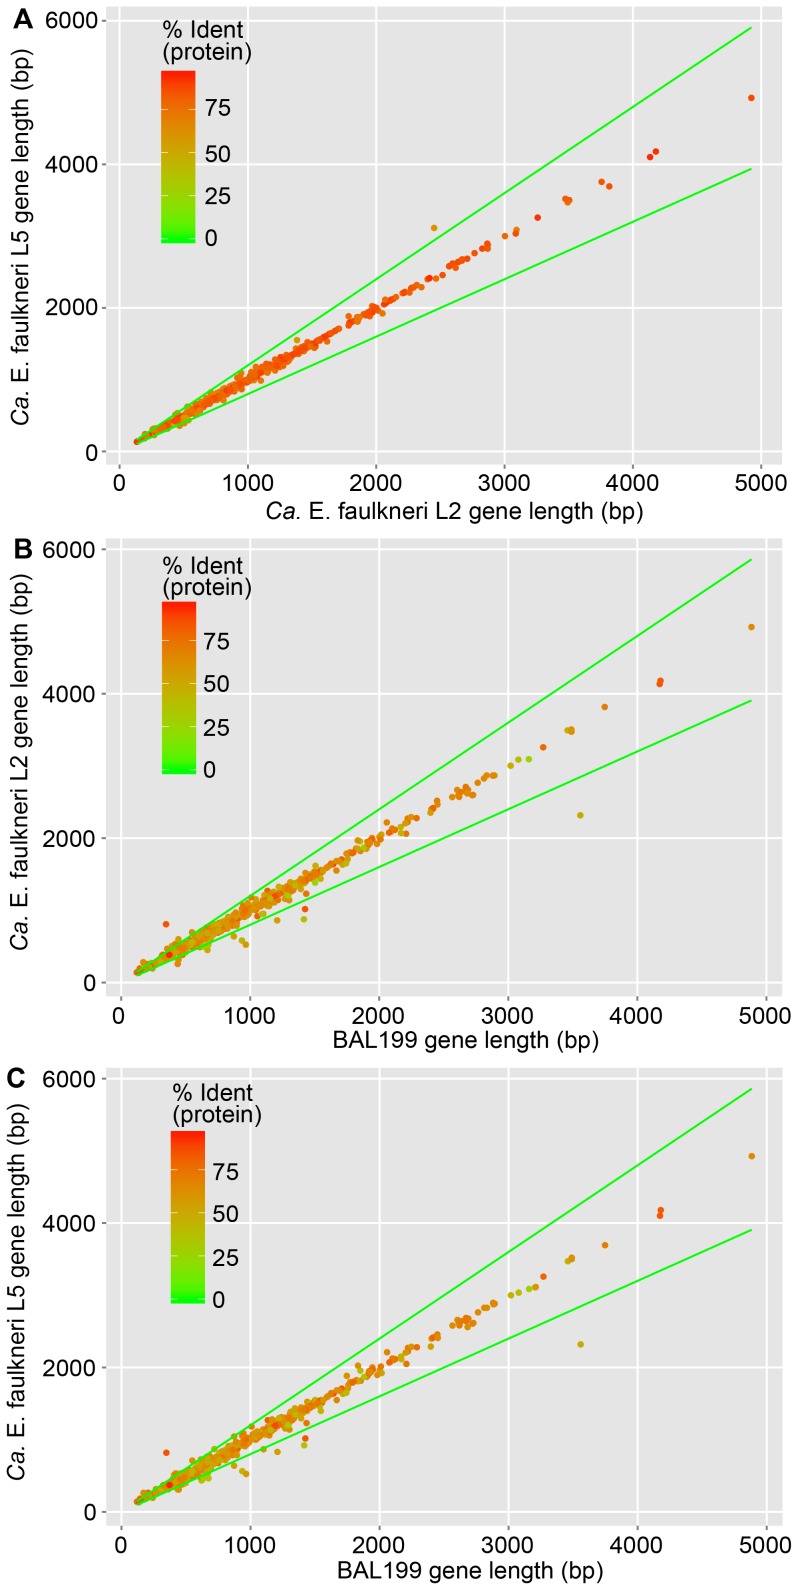
Figure 10. Only one gene varies in length by more than 20% in Ca. E. faulkneri strains L2 and L5, and only a few are truncated by more than 20% versus their homologs in BAL199.
Comparisons shown: (A) Ca. E. faulkneri L2 and L5, (B) Ca. E. faulkneri L2 and BAL199, and (C) Ca. E. faulkneri L5 and BAL199. Green lines denote a tolerance of ±20% of the x-axis variable. Note: the large PKS genes in the ptz pathway are omitted in order to avoid skewing the scale of axes in (A).

