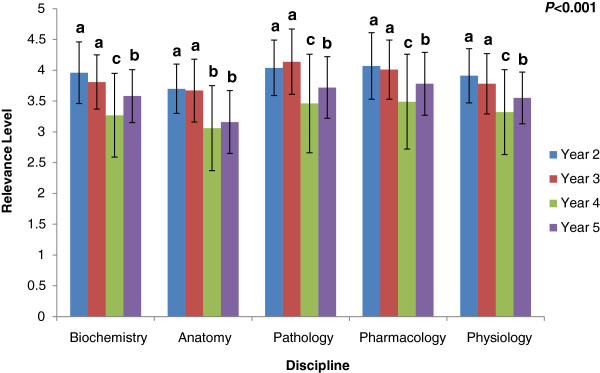
Figure 2.

Mean clinical relevance ratings (± standard deviation) by Year of study and level of significance (P-values) for each subject and overall exam score. Within discipline, differences are signified by letters above columns, differing superscripts (a, b, c) show significant differences (P < 0.01).
