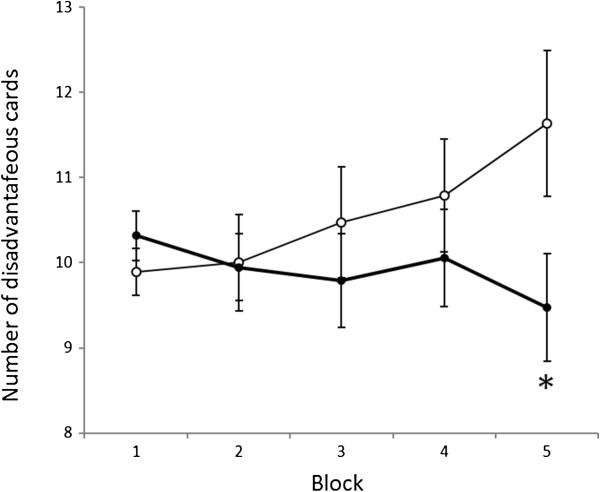
Figure 1.

Order of card selection in the Iowa gambling task from the first to the fifth selection. The solid and dotted lines show the mean number of disadvantageous cards drawn by PDD patients and controls, respectively, in each selection of 20 cards. Horizontal bars indicate the standard error of the means. Children with PDD chose more cards from the disadvantageous deck towards the end of the task. *P < 0.05 (Mann-Whitney test, significantly greater than controls).
