
Figure 6.
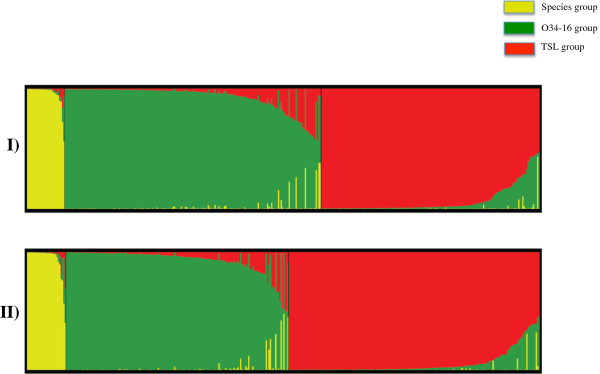
Graphical presentation of the results obtained from STRUCTURE using K = 3. Each individual is shown as a vertical line partitioned into segments representing the estimated coefficients of membership proportions in the three ancestral genetic clusters inferred with STRUCTURE. Individuals within each cluster are arranged according to estimated cluster membership proportions (Q-value). Detail of accessions in each cluster is provided in Table S9.