
Figure 6.
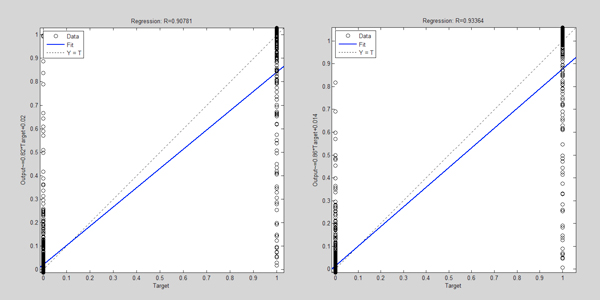
Comparison of test set correlation analysis of control model (left) and new model (right). In both graphs, the horizontal axis indicates the output objective (target) values, and the vertical axis is the output value of model.
Official websites use .gov
A
.gov website belongs to an official
government organization in the United States.
Secure .gov websites use HTTPS
A lock (
) or https:// means you've safely
connected to the .gov website. Share sensitive
information only on official, secure websites.
Comparison of test set correlation analysis of control model (left) and new model (right). In both graphs, the horizontal axis indicates the output objective (target) values, and the vertical axis is the output value of model.