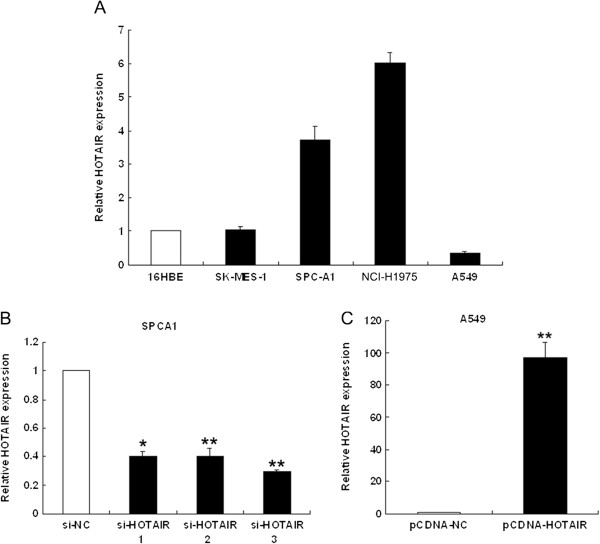
Figure 2.
HOTAIR expression levels in NSCLC cell lines. (A) qRT-PCR analysis of HOTAIR expression levels in NSCLC cell lines (A549, SPC-A1, NCI-H1650 and SK-MES-1) compared with the normal bronchial epithelial cell line (16HBE). (B, C) qRT-PCR analysis of HOTAIR expression following treatment of SPC-A1 cells with three individual siRNAs targeting HOTAIR and of A549 cells transfected with pCDNA-HOTAIR. *P < 0.05, **P < 0.01.

