
Figure 4.
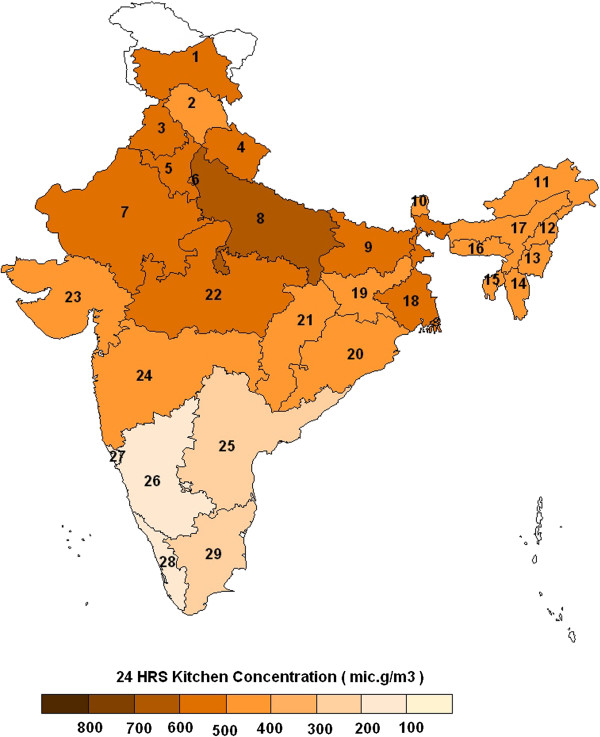
Weighted state estimates for average 24 hr kitchen area concentrations of PM 2.5 for all solid- fuel-using households in India (Note: Solid-fuel-using households include both urban and rural households. State estimates are weighted by the percentages of rural, urban households using solid cookfuels as the primary fuel, respectively. Numbers indicate names of states as provided in Table 3).