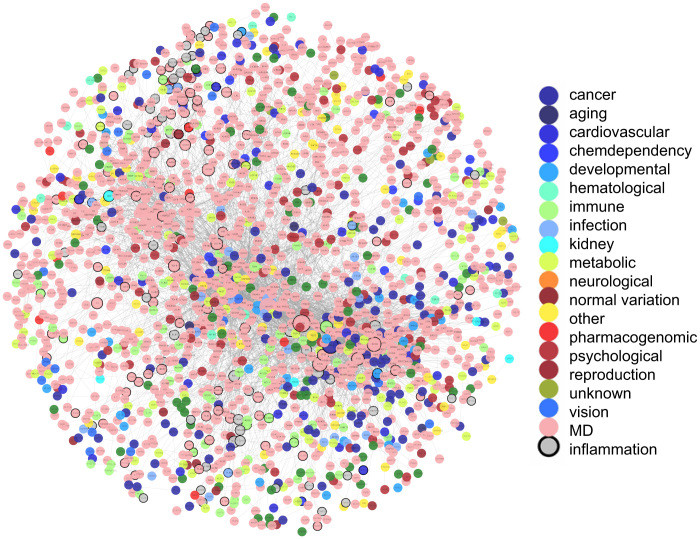
Figure 1. The disease and inflammation network (DIN).
The network is constructed by mapping disease genes and inflammation genes to the PPI network and then generating the maximal connected component as the DIN. Inflammation genes are colored in grey and disease genes are colored according to their classes. Those genes that are both inflammation genes and disease genes are drawn with black border. MD denotes genes involved in multiple disease classes.

