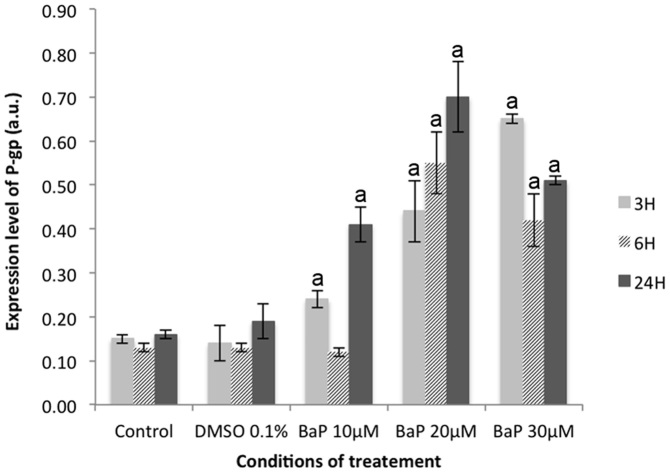
Figure 4. P-gp expression in brown trout erythrocytes in the presence of BaP.
Brown trout erythrocytes were exposed to 10, 20 and 30 μM of BaP. After 3 h, 6 h and 24 h of treatment, the cells were recovered to perform protein extraction. Following extraction, Western blotting was performed and protein expression quantified using Quantity One software (Biorad®). Statistical analysis was performed by Student's t-test. “a” indicate a significant difference (p < 0.05) in P-gp expression between BaP treated samples and controls.

