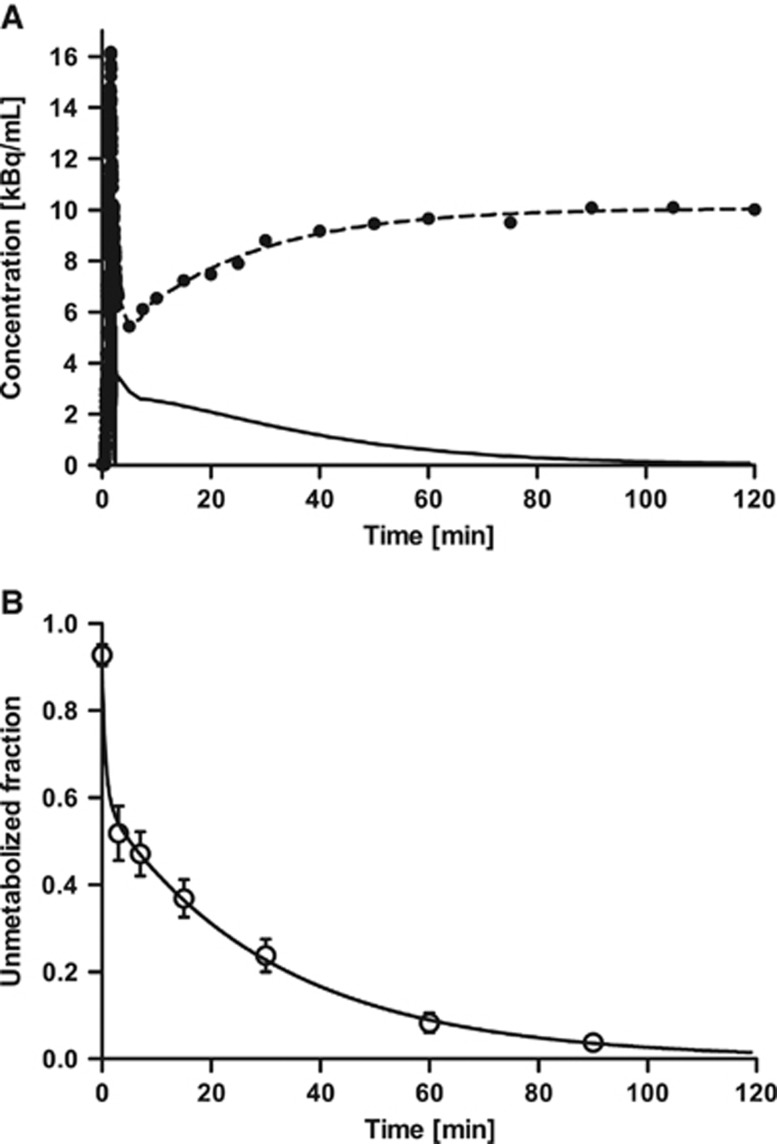
Figure 1.
(A) Typical example of time–activity curves of total radioactivity in the plasma (dots) and its fit (dashed line), and the corresponding metabolite-corrected input curve (solid line). (B) Mean±s.d. of unmetabolized [11C]AFM ([11C]2-[2-(dimethylaminomethyl)phenylthio]-5-fluoromethylphenylamine) fraction over time in 10 healthy human subjects and mean of fitted curve (solid line). The parent fraction was fitted using a sum of exponentials.

