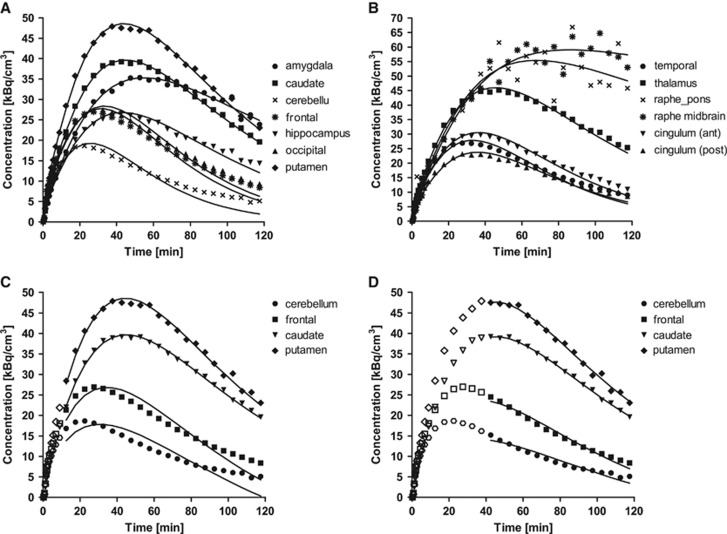
Figure 2.
Typical time activity curves in 13 region of interest (ROIs) measured after injection of 700 MBq of [11C]AFM ([11C]2-[2-(dimethylaminomethyl)phenylthio]-5-fluoromethylphenylamine). For each region, the symbols correspond to the measured activities and the lines are values fitted to one-tissue compartment model. Curves are shown in two graphs (A and B) for clarity, using different scales. Typical examples of fitting are shown for multilinear analysis with (C) t*=10 minutes and (D) t*=40 minutes. ROIs are cerebellum (circles, •), frontal lobe (triangles, ▴), caudate (downward-pointing triangles, ▾), and putamen (diamonds, ♦). Points used for the estimation are shown in closed symbols.

