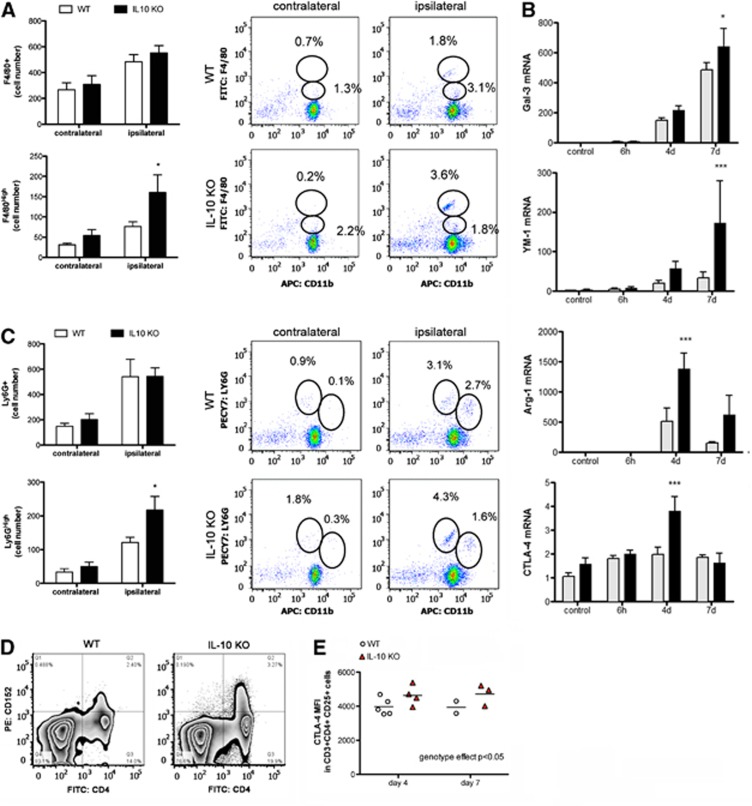
Figure 7.
Compensatory immunosuppressive mechanisms in interleukin-10 knockout (IL-10 KO) mice after ischemia. (A) Ischemia increases the number of cells expressing F4/80+ (microglia/macrophages) to a similar extent in both genotypes at day 4. However, more F4/80High phagocytic cells are seen in the brain of IL-10 KO than in wild-type (WT) mice. (B) The ischemic tissue of IL-10 KO mice shows a higher upregulation of the mRNA of galectin-3, Arginase-1, YM-1, and CTLA-4 (n=4 to 6 samples per time group). (C) At day 4, the numbers of Ly6G+ cells (neutrophils) are similar in the ipsilateral cortex of IL-10 KO and WT mice, but higher numbers of Ly6GHigh neutrophils are seen in the ischemic cortex of the IL-10 KO mice. Flow cytometry diagrams shown in the right panels of (A) and (C) correspond to one representative sample out of n=5 independent samples per group. (D) Representative dot plots of CTLA-4 expression (CD152) in splenocytes from WT and IL-10 KO mice 7 days after permanent middle cerebral artery occlusion (pMCAO). Single viable cells are plotted by CD152 versus CD4 expression. (E) Single viable splenocytes are subsequently gated on CD3+ CD4+ and CD25+ cells. CTLA-4 mean fluorescence intensity (MFI) in the latter cells is higher in IL-10 KO mice than in WT mice. Two-way ANOVA by genotype and time. *P<0.05 and ***P<0.001 versus ischemic tissue of WT mice.

