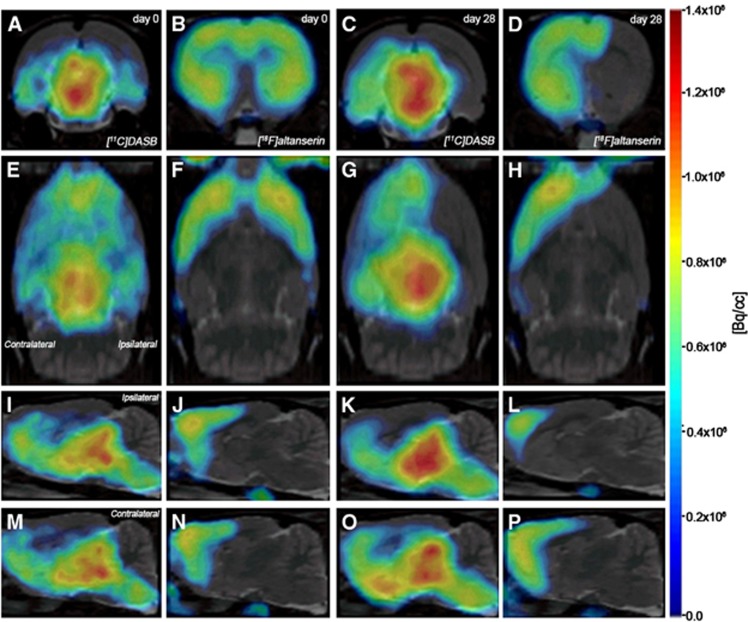
Figure 1.
Normalized positron emission tomography (PET) images of [11C]DASB and [18F]altanserin PET at day 0 and day 28 after middle cerebral artery occlusion (MCAO). PET images of axial (A to D), coronal (E to H), sagittal at the level of the ipsilateral (I to L) and contralateral (M to P) hemispheres are coregistered with a magnetic resonance imaging (MRI) (T2-weighting (T2W)) rat template to localize anatomically the PET signal. Images correspond to the same representative animal for each time condition and radiotracer.

