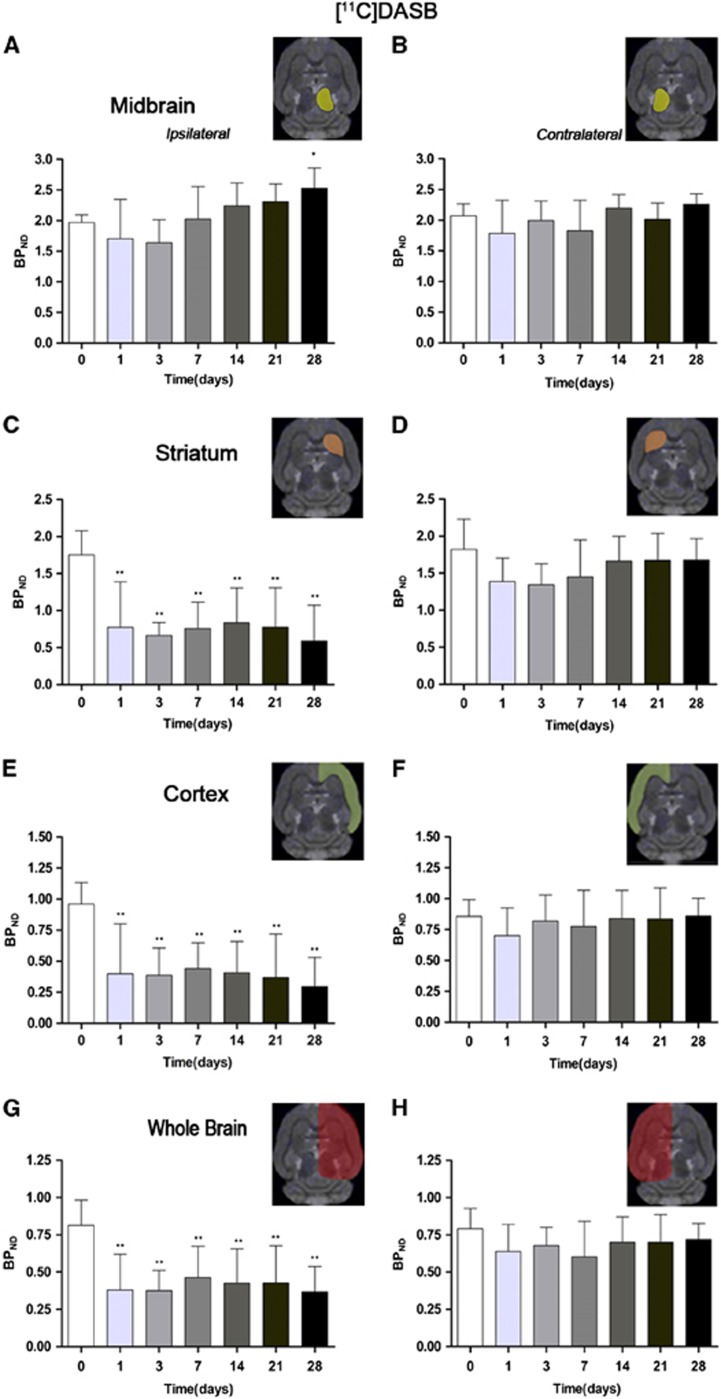
Figure 3.
Time course of the progression of the [11C]DASB positron emission tomography (PET) signal before and after cerebral ischemia. The binding potential nondisplaceable (BPND, mean±s.d.) of [11C]DASB (BP, mean±s.d.) was quantified in four volumes of interest (VOIs) over the ipsilateral (A) and the contralateral (B) midbrain, the ipsilateral (C) and the contralateral (D) striatums, the ipsilateral (E) and the contralateral (F) cortex, and the entire ipsilateral cerebral hemisphere (G) and the contralateral cerebral hemisphere (H). The upper right panels of each figure show the selected brain regions of interest (ROIs) for the quantification defined on a slice of a magnetic resonance imaging (MRI) (T2-weighting (T2W)) template. Rats (n=8) were repeatedly examined by positron emission tomography (PET) before and at 1, 3, 7, 14, 21, and 28 days after ischemia. Statistical analyses were performed by using one-way analysis of variance (ANOVA) followed by a post hoc Dunnett comparison test. Statistically different from control: *P<0.05 and **P<0.01.

