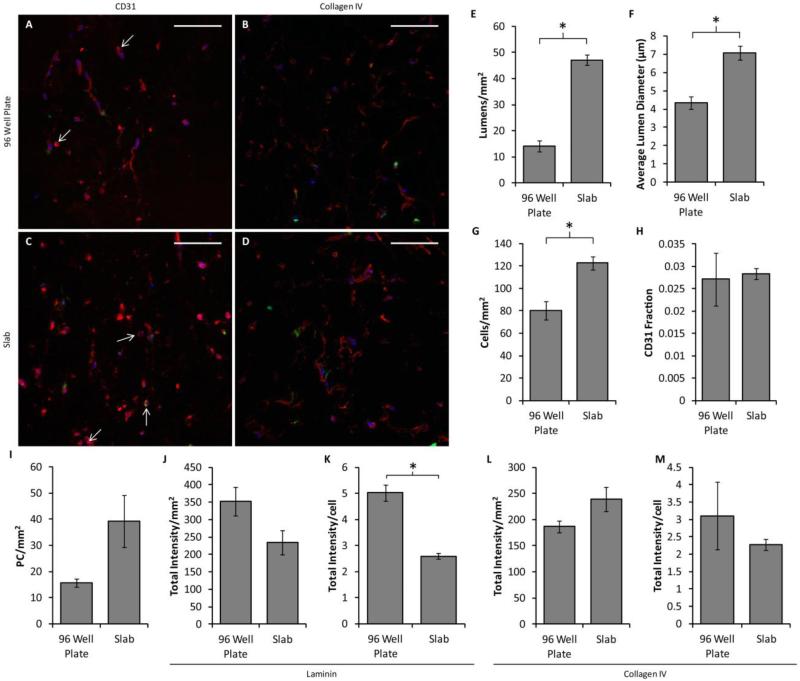
Figure 4.
Comparison of vasculogenesis between 96-well plate constructs and slabs. (A-D) Representative images of cross sections of constructs created in 96 well plates (A-B) or in the slab geometry (C-D) and cultured in defined medium, stained for either CD31 (A,C) or collagen IV (B,D) in red. PCs are green and nuclei are blue. Arrows indicate the location of lumens. Scalebars = 100 μm. (E-H) Quantification of microvessel properties from CD31-stained images, including lumen density (E), average lumen diameter (F), the total cell density (G), the area fraction of CD31 staining (indicative of EC density; H), and the PC density (I). The slabs contained more and larger lumens as well as a higher total cell density, although no differences were observed among conditions for either CD31 fraction or PC density. (J-M) Basement membrane deposition. No differences were observed in total staining intensity of sections stained for laminin (J) or collagen IV (L). However, laminin staining intensity normalized to cell density was reduced in the slab geometry (K). No difference was observed in collagen IV staining per cell. *p < 0.05.

