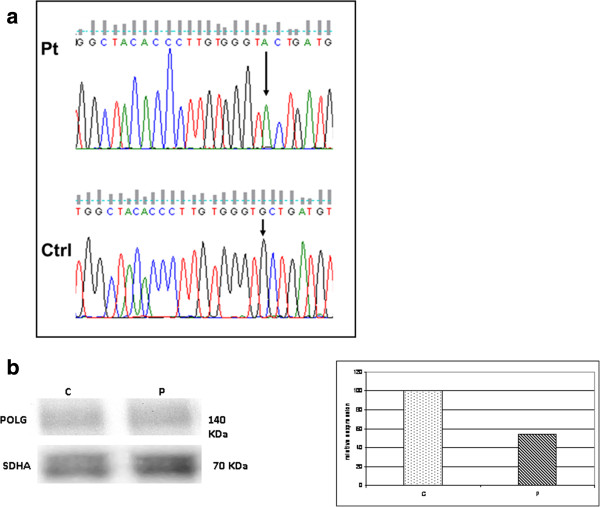
Figure 3.

Electropherogram of POLG (a) and Western blot and densitometric analysis of POLG protein (b) (1:100, ACRIS antibodies, Germany) in the patient and a control. a: The electropherogram with the region of the exon 17 of POLG flanking the homozygous mutation (c.2665G>A) identified in the patient. The electropherogram of a control is also shown. Arrow indicates the mutation. b: About 50 μg of skeletal muscle homogenate were loaded in each lane. POLG content was normalized using a monoclonal SDHA antibody (1:500, Mitosciences, USA). Levels of expression in the patient appear reduced (about 45% of control sample). A representative experiment is shown.
