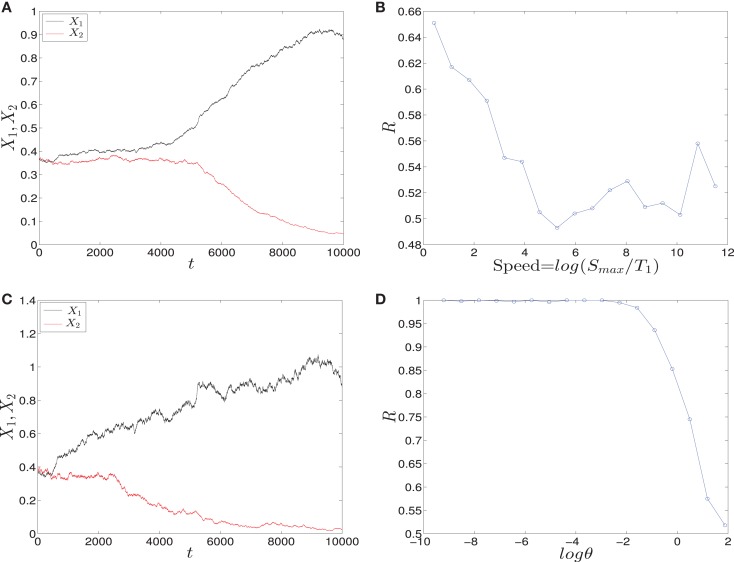
Figure 11.
Trajectories and effect of the external signaling speed. In (A,C) the time evolution of X1 and X2 under the effect of linear and adaptation form of signals is shown, respectively. The values of X1 increase and the values of X2 decrease because S1 is chosen to be faster than S2. Hence, trajectories choose the attractor which has a larger value of X1. (B) The effect of increasing the speed of linear form of signals for 1000 iterations. As the speed is increased, the ratio R tends to 0.5. Thus, increasing the speed increases the symmetry in the switch. (D) The effect of speed with the adaptation form of signals. Decreasing the speed gives ratio R tending to 0.5. Surprisingly, now decreasing the speed increases the symmetry in the switch. Parameters in (A), (B) are A = 2.5, Smax = 10, (C,D) h1 = h2 = 10, v = 10, and for all we have a1 = a2 = 0.05, b1 = b2 = 0.45, r = 0.5, k1 = k2 = 1.

