
Figure 2.
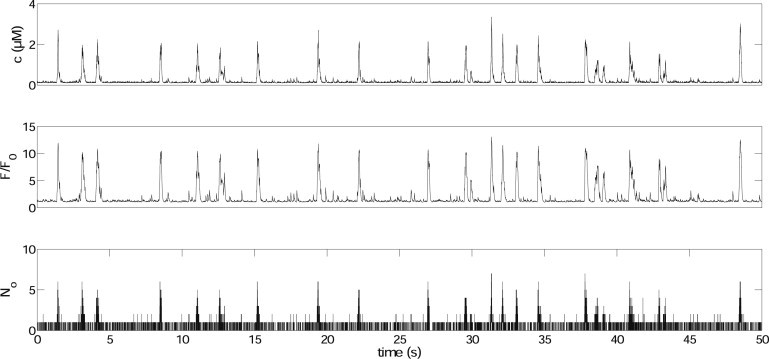
An example of simulation results of calcium puff traces. The top panel shows an example of the [Ca2+] trace (variable c in Eq. 11). represents the ratio of to its resting value. We set , μM, and s−1.
Official websites use .gov
A
.gov website belongs to an official
government organization in the United States.
Secure .gov websites use HTTPS
A lock (
) or https:// means you've safely
connected to the .gov website. Share sensitive
information only on official, secure websites.
An example of simulation results of calcium puff traces. The top panel shows an example of the [Ca2+] trace (variable c in Eq. 11). represents the ratio of to its resting value. We set , μM, and s−1.