
Figure 4.
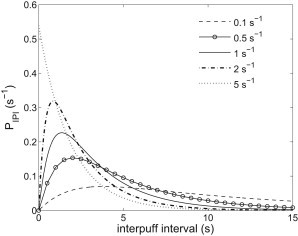
Various simulated IPI distributions for different . We set , μM. The values of are indicated in the legend. For a given , we choose appropriate values of λ and ξ to fit to the corresponding simulated IPI distributions using Eq. 14 or Eq. 15. Then the values of λ and ξ are used to plot these curves in the figure. Fitting details and results are given in the Supporting Material.