
Figure 8.
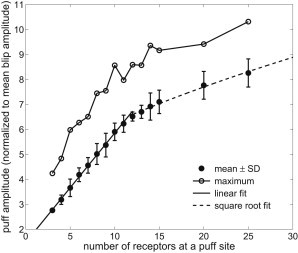
Dependence of average puff amplitude and the largest puff amplitude on the number of IP3R at a puff site. Amplitudes are normalized to mean blip amplitude, 1.6. A linear fit is performed for , whereas a square root function gives an excellent fit to the points of . The average puff amplitude is expressed as mean ± SD. We set μM and s−1.