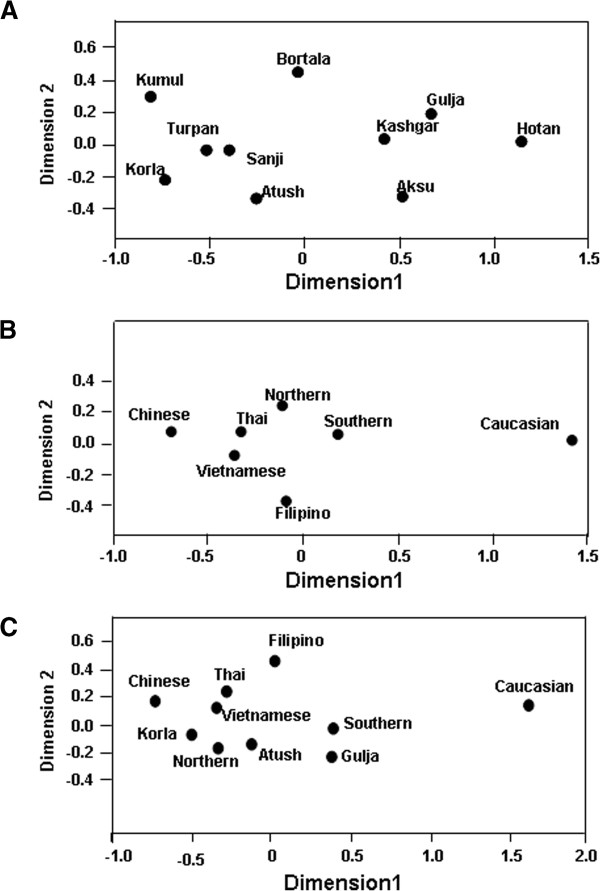
Figure 3.
Multiple dimension scale plot by SPSS. (A) MDS plot of ten different regions' Uyghur people. (B) MDS plot of geographic-based southern and northern Uyghur population. (C) MDS plot of regrouped populations. Other populations were cited from [14].

