
Figure 1.
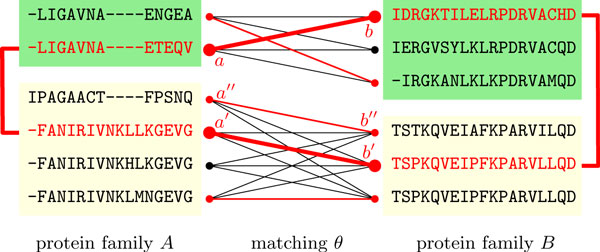
Two alignments of protein families A and B with proteins from two species, which are indicated by different background colors. Black and red nodes and edges compose the matching graph G. A matching θ is shown in red. A unit of coevolution ((a, b), (a', b')) within θ is highlighted in bold. For this toy example, we have ℓA(a, a') = 12 (matches + mismatches), ∆A(a, a') = 11 (mismatches), ℓB (b, b') = 19 and ∆B (b, b') = 15 and a resulting probability . Note the lower score of the unit ((a', b'), (a", b")), which is .