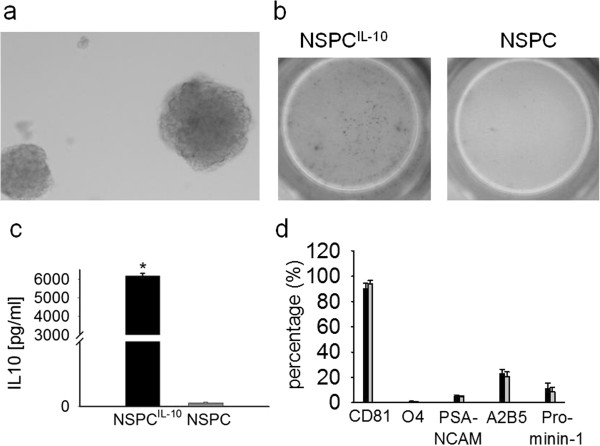
Figure 1.
NSPC and IL-10 production. (a) Morphology of neurospheres as demonstrated by a phase contrast image of a representative neurosphere culture in presence of 20 ng/mL FGF-2 and 20 ng/mL EGF. (b) IL-10 production of NSPCIL-10 and NSPCs was determined by IL-10 ELISPOT assay (dots indicating IL-10 producing cells), and (c) IL-10 ELISA. *t-test, P <0.001. (d) Analysis of NSPCIL-10 (black bar) and NSPCs (grey bar) for expression of different stem cell markers by flow cytometry. EGF, epidermal growth factor; ELISA, enzyme-linked immunosorbent assay; ELISPOT, enzyme-linked immunosorbent spot; FGF, fibroblast growth factor; IL, interleukin; NSPC, neural stem/progenitor cell; PSA-NCAM, polysialic acid neural cell adhesion molecule.

