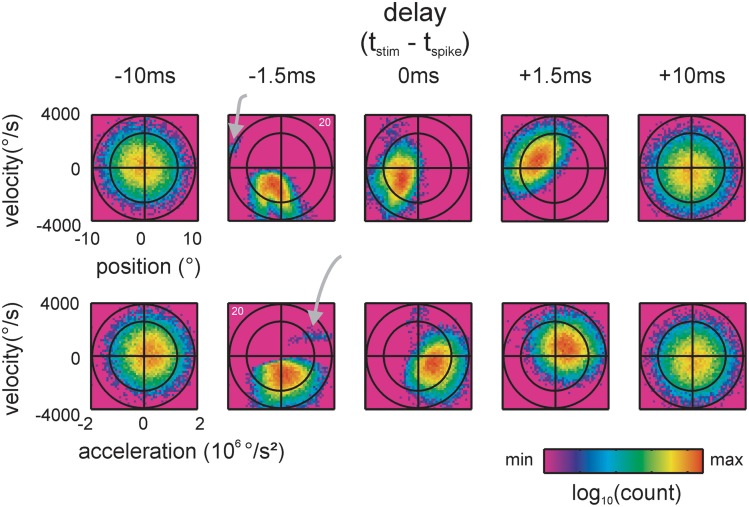
Figure 3.
Spike-triggered kinematic features. Two dimensional projections, taken from the 3D distributions of stimulus space spanned by position, velocity and acceleration, are shown. Top: position and velocity. Bottom: acceleration and velocity. The two ellipses (black lines, scales are chosen such that they appear as circles) indicate the total stimulus space (2 times and 3 times standard deviation of the 2D Gaussian). 2D histograms of the spike-triggered stimulus ensembles (color-coded) are plotted on top. Five delays between the occurrence of the spike and the stimulus feature are shown. At negative delays the spike follows the occurrence of the stimulus feature. Note the sharp and lobed sub-space (a separated preferred stimulus/lobe is marked by gray arrows) emerging when the stimulus is sampled 1.5 ms before the spike. (data of cell 20, cf. Figure 2D).

