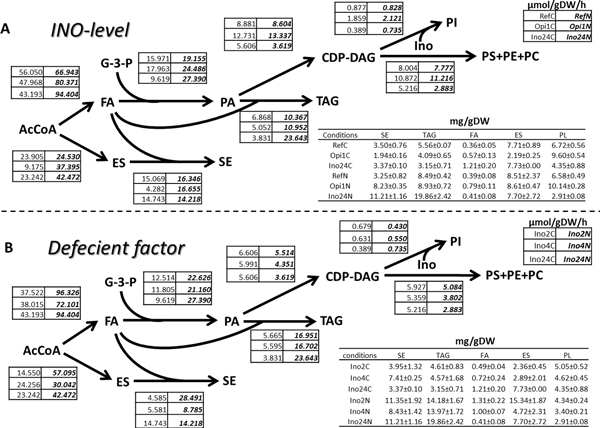
Figure 5.
Fluxes through the different reactions of the lipid biosynthetic pathways. Fluxes through the different reactions of the lipid biosynthetic pathways for diferrent INO-levels (A) and diferrent deficient factors (B). All fluxes are shown in units of μmol/gDW/h. The normal font (left) and bold font (right) indicate the value from C-limitation and in N-limitation respectively. The level, in units of mg/gDW (±SD), of the different lipid species are shown in the table. (C = C-limited, N = N-limited).

