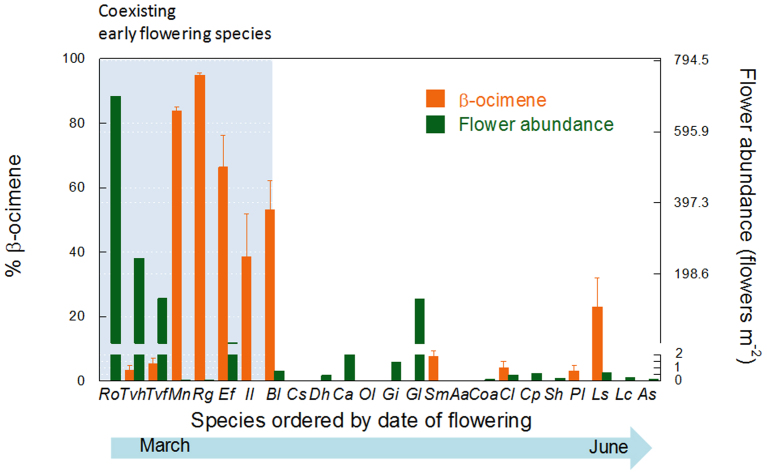
Figure 3. Plant abundance hypothesis.
Flower abundance (number of flowers per m2) and percentage of β-ocimene emitted relative to the total emission of terpenes by the plant species of the Garraf shrubland community ordered by date of flowering peak as described in Figure 2. Note the break in the axis for the flower abundance. Note that although peaking in the second half of the season, Bl- Biscutella laevigata overlaps with the early flowering species throughout March and April. Error bars are SE (n = 5).

