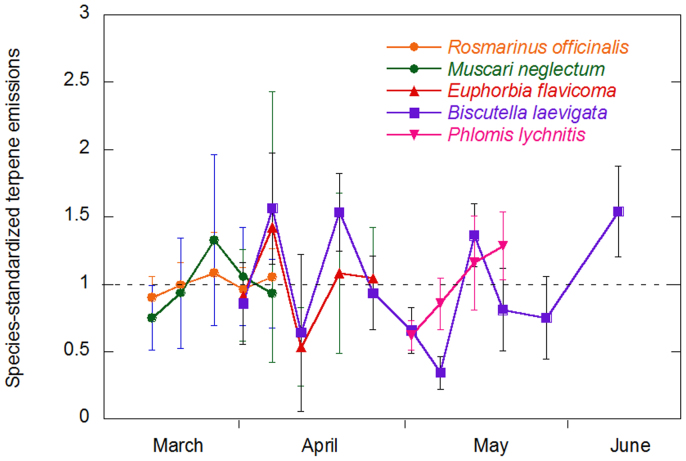
Figure 4. Species-standardized terpene emission rates (μg g−1 h−1) (emission rates were divided by the mean emission rate of each species) of five representative species throughout their entire blooming period.
Error bars are SE (n = 5). Species standardized β-ocimene emission rates also followed no particular pattern (data not shown).

