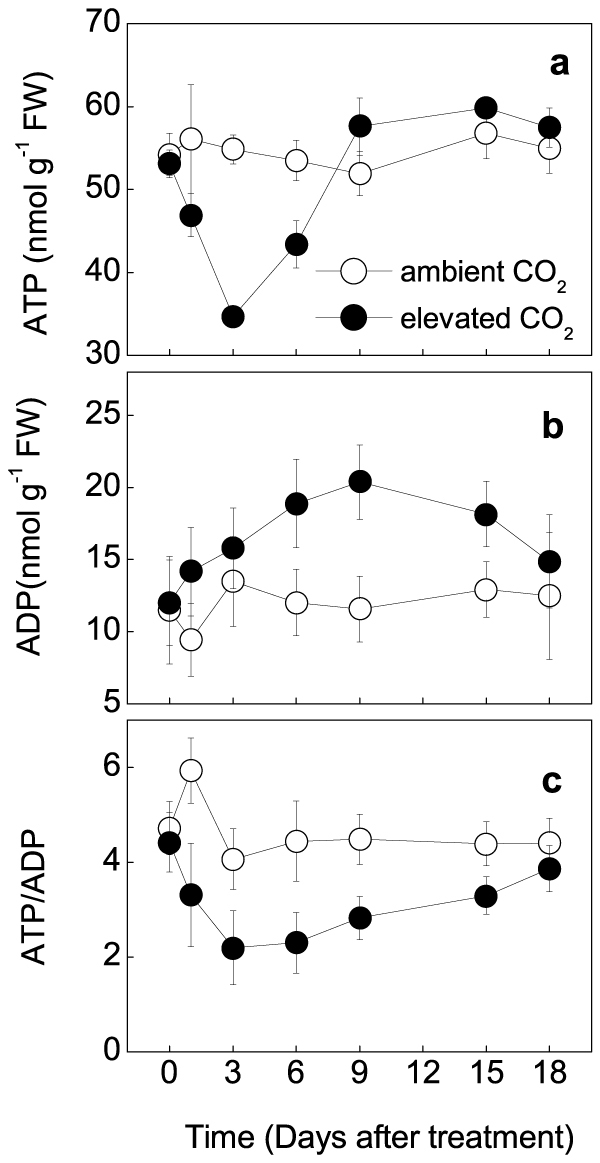
Figure 4. Changes in the adenylates levels of tomato plants grown at ambient (380 μmol mol−1) or elevated CO2 concentrations (800 μmol mol−1).

(a), ATP; (b), ADP; (c), ATP/ADP; Values are means ± SD (n = 6).

(a), ATP; (b), ADP; (c), ATP/ADP; Values are means ± SD (n = 6).