
Figure 1.
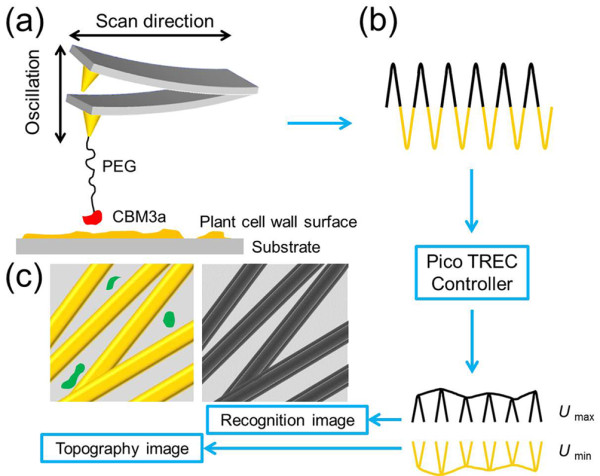
Schematics of AFM recognition imaging. (a) AFM tip modification and recognition imaging process; (b) topography and recognition signal division by PicoTREC controller; (c) example of topography and recognition images generated by separated signals. Yellow strips: sketch of crystalline cellulose; black strips: recognition signal of crystalline cellulose in topography image; green marks: other components which do not have specific interactions with functionalized AFM tip and show no recognition signals in the recognition image.