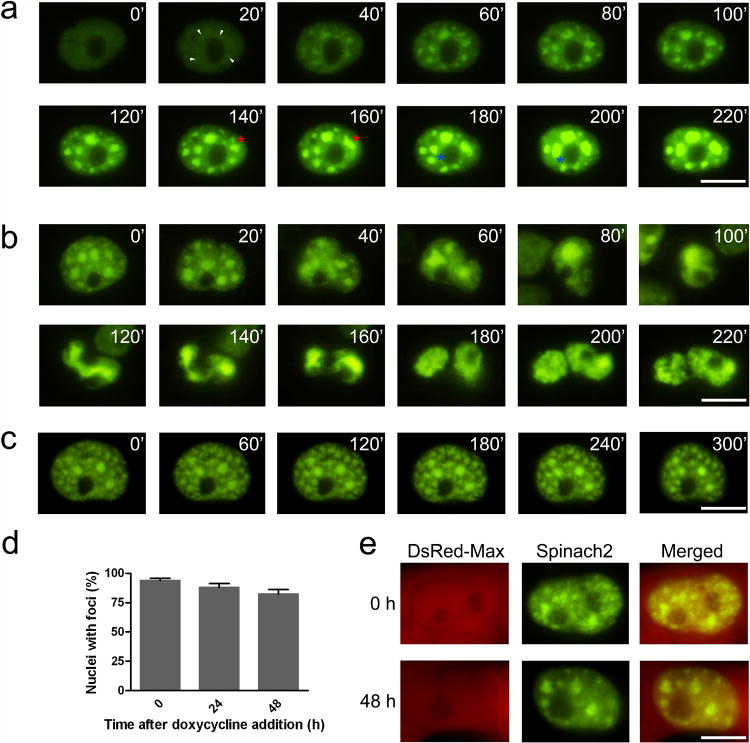
Figure 5. Imaging RNA foci in COS-7 cells.
(a) Foci formation in COS-7 cells after transient transfection with a CGG-Spinach2 vector. At 2 h post-transfection, cells were incubated with imaging medium containing DFHBI and imaged every 20 min for 6 h. In these images, time zero indicates the first frame that displayed fluorescence above background. Small foci formed de novo (white arrowheads) are highlighted. Merging foci are also highlighted foci (red and blue asterisks). Scale bar, 10 μm.
(b) RNA foci are partitioned and divided during cell division. Scale bar, 10 μm.
(c) (CGG)60-Spinach2 signal persists in foci after transcriptional silencing. Cells containing CGG aggregates were treated with 1 μg/mL actinomycin D to inhibit transcription and monitored for changes in foci. Images obtained every hour for 5 h are shown. Scale bar, 10 μm.
(d) (CGG)60-Spinach2 signal persists in foci for over 48 h after transcriptional silencing. A TET-Off expression system was used in COS-7 cells to test foci stability in the absence of new transcription over longer time periods. Data shown represent the mean and s.e.m. values for three independent replicates in which 100 DsRed-positive cells were counted for each treatment.
(e) Representative nuclei for 0 and 48 h after doxycycline addition. Scale bar, 10 μm.

