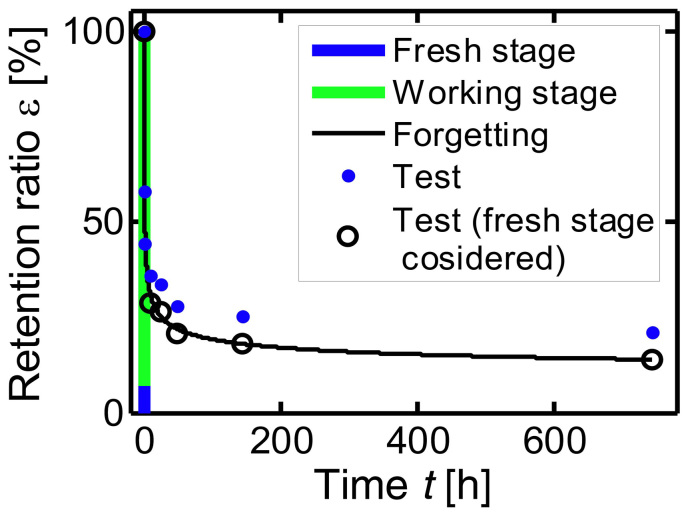
Figure 3. Forgetting curve.
The blue dot markers denote Ebbinghause's forgetting curve15. The blue line is the fresh stage, the green line is the working stage of learning, the black line is our forgetting curve, and the black circle markers are the test data with fresh stage taken into account. The learning stages are much shorter, and if the horizontal axis scale magnified the shapes of learning curves are like the creeping stage of Fig. 1.

