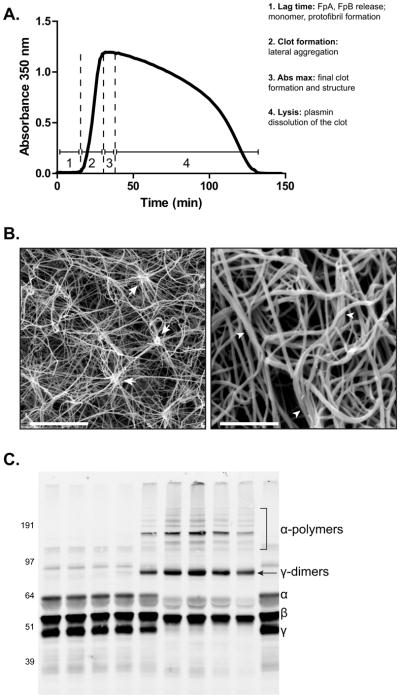
Figure 2.

Techniques for measuring functional properties of fibrinogen. A) Turbidity assay showing both clot formation and lysis over time as a function of changes in absorbance. Thrombin, CaCl2, and either tPA alone or tPA and plasminogen are added simultaneously to PPP or isolated fibrinogen, respectively and clot formation and lysis time are monitored by changes in absorbance at 350 nm as a function of time. 1. The lag phase represents the formation of fibrin monomers, oligomers, and protofibrils. 2. Protofibrils that have reached a sufficient length laterally aggregate to generate fibers, causing a rapid increase in absorbance. 3. Eventually the clot is fully formed, which is represented by the maximum absorbance. 4. Subsequently, with binding of both plasminogen and t-PA to fibrin, plasmin lyses the clot, indicated by a decrease in absorbance. B) (Left) Scanning electron micrograph of a clot generated from isolated fibrinogen containing high levels of nitrated fibrinogen molecules. Magnification bar represents 10 μm. Arrows indicate clusters, defined as 8 single fibers crossing at a single point. (Right) Scanning electron micrograph of a clot generated from the PPP of a PE subject. Magnification bar represents 2 μm. Arrowheads designate fiber bundles, defined as 3 or more fibers aligning together for greater than 1 μm. Fiber density is commonly measured manually by counting the number of fibers in a small, designated area repeated over the entirety of the micrograph. Fiber diameter is also measured manually, often using Image J (Rasband, W.S., ImageJ, U. S. National Institutes of Health, Bethesda, Maryland, USA, http://imagej.nih.gov/ij/, 1997–2011) or other software that is capable of determining distance. Here, the widths of many fibers are measured within the micrograph either in designated areas or at random. C) Western blot of FXIIIa crosslinking fibrin in PPP. Addition of thrombin and CaCl2 in PPP initiates both fibrin polymerization and FXIII activation. In isolated fibrinogen, FXIII must also be added to induce crosslinking. FXIIIa crosslinking of fibrin creates both γ-dimers and α-polymers. The reaction is allowed to proceed for the desired time point(s) followed by quenching with concentrated sample buffer containing a reducing agent and boiling. The products of the reaction are then run on an SDS PAGE gel followed by Western blot analysis with an anti-fibrinogen antibody. Lane 1) 0 hr 2) 5 min 3) 15 min 4) 30 min 5) 1 hr 6) 2 hr 7) 4 hr 8) 8 hr 9) 24 hr 10) No thrombin or CaCl2.
